Big Update on R Trader Multi-Asset Platform
 Big news for the users of the R Trader multi-asset platform!
An important update involving the desktop and mobile versions has been installed on the platform. With this recent update, users now have several additional options available. The desktop version gets several new features like the Calendar of Corporate Events, four new indicators and extended statistics related to client’s accounts.
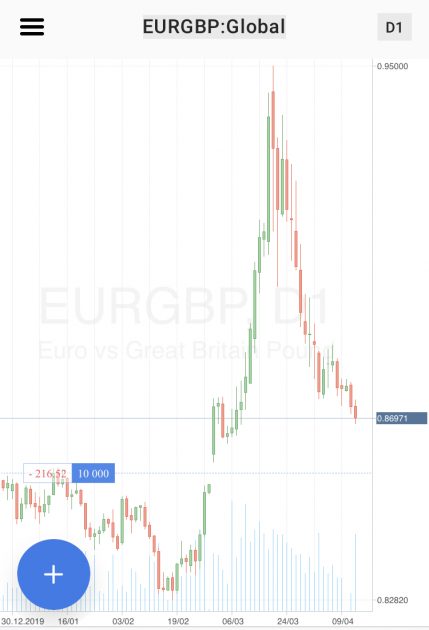
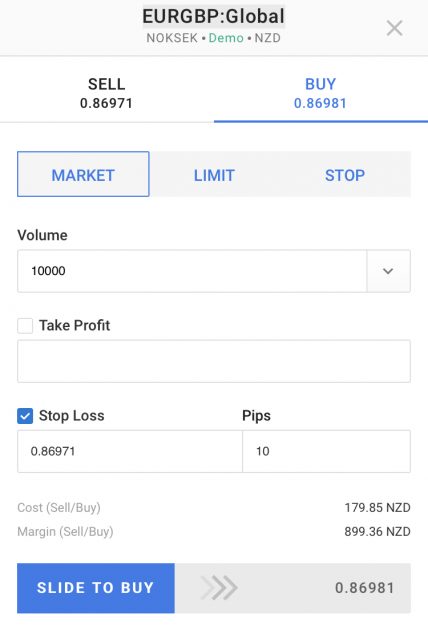
R Trader Mobile - Additional Features
- Availability of Watchlists
- The chart will now display additional positions like Open Price, SL, Profit and TP
- Order placement can now be confirmed by swiping right
- Sorting has been added to Active Orders, Trade Blotter, History, Positions
- The pages for Deposit/Withdraw and Cash Correction have been added in History


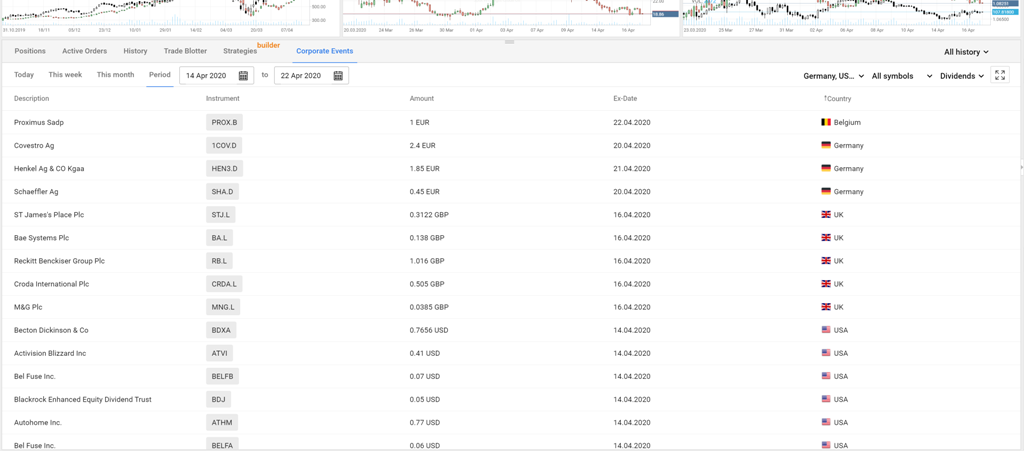
Addition of Corporate Events
In R Trader, all necessary information related to financial instruments is now available in one place that is contract specification by Instruments and Corporate Events Calendar. The different corporate events available include:
- Dividends: Sums and Payment days – Dividends are an important part of the net profit which are available for distribution between stockholders. In case of indices, commodities and forex, the income is largely dependent on price movements of the instrument. Price movement prediction is quite tough and challenging. But, in the stock market, dividends are received by stockholders which is a big advantage.
- Earnings: Publication Date of financial reports – Stock quotations are directly influenced by the financial results of the company. The financial reports are mainly for four quarters – January, April, July, and October.
- Splits: Split ratio, consolidation coefficient of stocks and the dates. When there is a significant fall in price, stocks require consolidating or splitting or else the stock price of rivals is over/understated, quite significantly.

Graphical Representation of Statistics
The R Trader platform is now updated with some handy charts for better analysis of trading. The results of each account are well represented through charts that include a variety of trading characteristics like deposit load, profitability, equity, drawdown, and balance. Traders can now assess the different changes in the account, improve their results and decrease risks. Such an instrument is available for all traders with an active R Trader account or even with a demo account. In future, traders might be able to even share the specific link to their results or even post it on a website or a blog. Also, there will be a scope to compare results with that of the other traders who are on the platform.

Built-In Indicators
The platform is now updated with four new indicators
- Volume Weighted Average Price or VWAP – This indicator is a representation of volume weight average price. Standard deviations and this price can be useful for market analysis and can also act as key levels.
- Force Index – This functions to measure of force of bears and bulls right at the decline or growth of any selected asset.
- Pivot Point – This is a tech analysis indicator. It functions to calculate the general market trends of different periods.
- Donchian Channel – Created by Richard Donchian, the indicator forms on the basis of lows and highs of last n periods. For any selected period, the area which is between the low and high is the trading channel.
In future, there will be an addition of a system of automatic reinvestment of dividends. Keep an eye for the next update!
For more please read the Roboforex Review

