
Forex Time Frames: A Brief Overview
 Time frames in trading Forex basically denote the time period that is represented by the real body of the candle. The gap between the opening price and closing price of an asset as represented by the real body of the candle denotes the time frame. Traders interested in the currency pairs choose to study charts of different time frames or may study a single time frame chart.
In the previous article, we have learned about the three main types of Forex trading charts (line, bar and candlestick). There are also variations within each variety of charts like the daily chart, hourly chart, weekly, monthly chart and so on. Time frames in trading Forex basically denote the time period that is represented by the real body of the candle. The gap between the opening price and closing price of an asset as represented by the real body of the candle denotes the time frame. Traders interested in the currency pairs choose to study charts of different time frames or may study a single time frame chart.
The traders tend to use the longer term charts to see the price action of an asset over a larger period of time and how the traders responded to a particular situation. This helps in analyzing the present market scenario for a particular asset. Shorter-term charts are mainly used to decide at which position to enter and exit a trade. MACD is often utilized as an entry trigger along with these short time frame candlestick charts. Broadly speaking, the trader can choose the Forex chart time frame based on their approach.
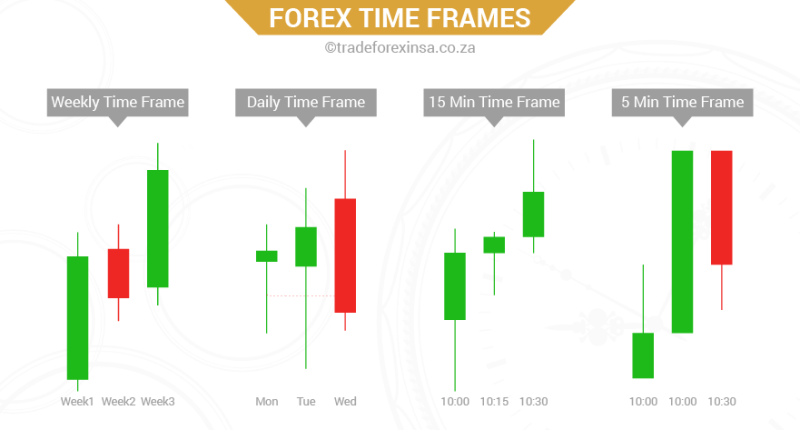
Forex time frames
Long-term approach: Utilizing weekly and daily charts
Often the novice traders avoid the long-term approach as the notion is that it will take up a considerable amount of time to receive profits. However, according to the experienced traders this approach is one of the best ways to frame a Forex trading strategy. On the contrary, it takes longer to develop a trading strategy with the short-term approach. This is because shorter candles are more likely to contain less information. Therefore, the novice Forex traders should start with a longer term approach and then gradually move on to the shorter term approach as they meet success with the prior stated strategy. The shorter candles often signify the volatility of the market. The trader, as he gains experience, will be able to carefully devise a strategy with the short-term approach by analyzing the risks.
The trader taking the longer term approach generally uses the weekly charts to determine the trend of the price of the currency pair. And, the daily charts are usually used to determine the moment at which it would be most profitable for the trader to enter into position. This entry point and the current market trend can be determined by studying the price action of the particular asset. It can also be done with the help of indicators like MACD (moving average convergence divergence).
Swing trader approach: Utilizing daily and 4-hour charts
As the neophyte begins to gain some Forex trading experience, he can move on to the swing trader approach that introduces a little variability. This approach can be said to act as a bridge between the longer-term approach and the shorter-term approach. With this approach, the trader can benefit by eliminating the negativities of the other two approaches. The swing traders often minutely follow the chart all day long to identify and analyze the ‘big’ moves in the market. Thus, the trader need not necessarily watch the market he is trading in continuously. If they find a situation that is akin to the one they have already studied, they can open or close a position, as the situation demands. The traders can also use the stop loss tool that will reduce the losses.
The major advantage of this approach is that trader can continue to look at the trading charts such that they do not miss out any opportunity and at the same time do other activities. The daily chart is utilized by the swing traders to determine the trend of the market while the 4-hour chart specifically talks about the entry and exit point. Indicators like MACD. Stochastics and CCI are often used along with the 4-hour chart for placing positions.
Short-term approach: Utilizing hourly, 15 minutes and 5 minutes charts
The shorter the time frame the trader chooses to trade in, the more liquid market they will experience. This is one of the crucial reasons the beginners are asked to master the longer term approach first before trying out the shorter term approach. It is important to time the market properly as every second matter and the trader has to minutely follow the price movements of the currency pair. The day trader or the scalper has to speculate the next immediate move of the price of the asset. Sometimes these traders try to ‘force’ a move on the market that may not always be successful. As the probability of making a profit is not so high in short time frame trading, the trader has to make the most of the tighter stops. The trader has to accept that there may be a chance of loss as the price of an asset may drop a little even when the general market trend is in the upward direction, and vice versa.
For the short term approach, the traders mainly use the hourly charts to determine the current trend of the market. The 5 minutes and 15 minutes time frames are used to minutely observe the movement of the asset that will show the point at which it would be best for the trader to enter the market (place a position). The 1-minute chart can also be used in the Forex market, but the trader needs to extremely careful about it as it means the trader will have to look into every second movement of the price. The MACD indicator helps in determining the entry and the exit point.
The most common time frames used by the traders to trade the currency pairs are 1 minute, 5 minutes, 15 minutes, 30 minutes, 1 hour, 4-hour, daily, one week, one month and one year charts. As observed, the smaller time frame charts are combined with the larger time frame charts to devise a sound trading strategy, for instance, the weekly chart with daily chart, 5 minutes or 15 minutes chart with hourly charts, and 4-hour chart with daily charts.
