
HOW TO READ STOCK CHARTS – INTRODUCTION FOR BEGINNERS
Stock charts are numerical charts that help in understanding the price action and behaviour of the stocks. The trading chart on a stock provides crucial information that helps a trader to develop a strategy and understand whether the stock should be bought or sold. Charts are vital in the trading world irrespective of the type of asset and they can be considered as one of the primary tools for technical analysis. Historical market data is plotted on the stock charts in the form of a graph. The graph patterns help the traders to identify and understand the price patterns. This, in turn, helps to determine whether the stock will trade in bull, bear or range.
As a beginner in stock trading, one should start with the following points to read and understand the stock charts.
STOCK-CHART AT IQ OPTION
Identifying the trend line: The trend line basically represents the direction in which the price of the stock is currently moving. When mapped on a chart, the trend line also shows the historical market data of the stock. If a trend line shows an upward movement, then the price of the stock is increasing while a downward movement shows that the price is decreasing. In case of stock market, the price action can also represent range-bound market, that is, when the price is mapped sideways.
Identifying the current support and resistance: The support and resistance lines can be said to be subjective as they depend on the trader’s perspective. The support line and resistance line are usually taken considering their investment horizon or how long they plan to hold on to the shares. The support line can also be derived from the lowest price almost touching the line in a given time period. The resistance line would be the highest price almost touching the line within the said time period.
Finding the dividends and stock splits: The dividend can be observed near the bottom of the chart when the company has issued a dividend. The same goes for stock split. A dividend occurs when the company or its board of directors decide to give a part of the company’s earnings to the shareholders. The trader owning a part of the company’s stock will receive a small portion of the profit in case of a dividend.
Studying historic trade volumes: Usually, the stock charts show many small, vertical lines at the bottom. This denotes a trend of the volumes at which the stock of a particular company is traded. The trading volume usually increases when there is major good news and reacts negatively when there is major bad news.

VOLUME INDICATOR AT IQ OPTION
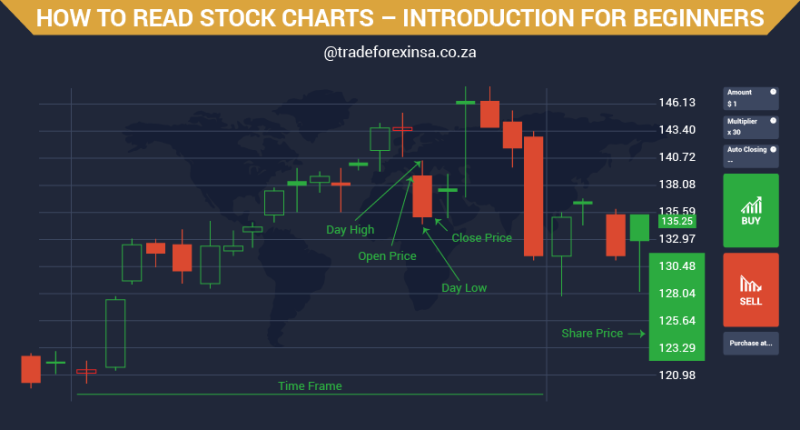
Some terms to get acquainted with: Open indicates the price of a stock when the exchange had opened, that is, trading had resumed. High generally refers to the highest amount the stock had reached for the day while Low refers to the lowest price. Market capitalisation denotes “the number of outstanding shares multiplied by the stock’s current price”. Price to earnings ratio refers to the price of the stock when divided by the earnings per share. Dividend yield is the annual dividend payments divided by the market cap of the stock. Previous close refers to the price of the stock the previous day when the market had closed. 52-week high and 52-week low refers to the stock’s highest and lowest trade price over the last year respectively.
Fundamental and technical analysis are equally important when it comes to trading stocks. The stock charts map the reaction of a particular stock to major news and several other factors. They are the indicators to create a trading strategy and help the traders.
